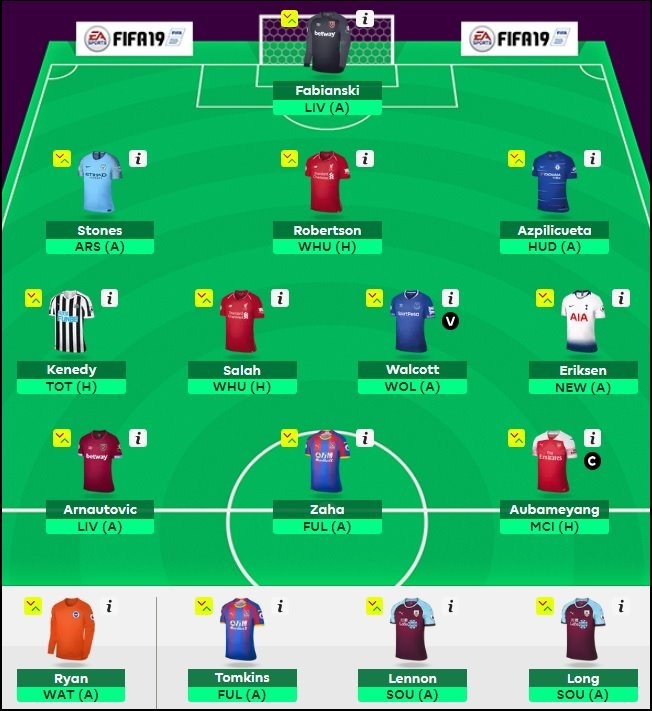
While five defenders at the back might not be a preferred formation when the season kicks off on August 10th, I have been doing my own research and breaking down numbers to see how they correlate to the players under consideration for my squad. It’s the first time in five years of playing I have looked in depth at some key metrics, to understand their simple equations breaking down minutes, points and games played to provide values for each player.
Fantasy football, like many fantasy games is simple, select the best players, score the most points and walk away the winner. There is very little truth to that statement, as fantasy managers potentially spend hours building and tweaking their 15-man squad up until the Gameweek 1 deadline. We’ve all been there, feeling confident about our starting XI and the player with the captain’s armband, then you read a late article, see a discussion on social media or have a gut feel and you change your team.
This season, in an attmempt to avoid some of the late changes and knee-jerk type of decisions, letting the numbers back up player selections to start the season. I’ve scoured the Internet in the last few weeks building my draft teams, with Salah and no Salah, only to walk away unsettled, destined to return later, only to see he’s still priced at £13.0m.
In my research I ran across a key metric that was unknown to me, called VAPM or ‘Value Added Per Million.‘ This metric falls in line with others that are used to measure players scoring of viability as a positive influence on your overall score. We’ve seen points scored/90 (PP90) and points scored/match (PPM) and even points scored/match/million (PPMM). Statistics are broken down to get you raw data to pinpoint players, for inclusion in your starting XI.
In my research, I ran across new metrics, including VORP, value over replacement player, which is discussed by FPL_Scientist and xFPL put forth by Planet #FPL stat man @fplkernow. However, the key metric grabbing my attention has been VAPM or value added per million. This metric uses PPM as a base and “by deducting 2 points from PPM, we eliminate the effect of points earned by simply existing on the pitch for 60 minutes. This also diminishes the value of substitutes who score 1 point for a cameo,” as explained by u/HappyGrinch on Reddit. By using this calculation, you allow for a better comparison between players across all positions in FPL.
For example, let’s use Chelsea’s, Willian and Arsenal’s, Aaron Ramsey for comparison. Both players scored 130 points last season and were priced at £7.5 to start the 2018/19 campaign.
The chart indicates key metrics used in this comparison, with both players averaging a similar PP90. By playing 12 fewer matches, Ramsey has a PPM that is 1.81 higher than Willian. The PPM comparison works for like players, as in this example, but makes it “difficult to compare the value of players at different price points.” Ramsey gets a further boost based on his PPMM, however this metric will overvalue cheaper players. HappyGrinch concludes, “This is why many people wrongly conclude that defenders are generally better value than attackers.” VAPM is the telling factor, as Ramsey’s 0.46 is considerably better than Willian at 0.21.
This example compares Luka Milivojevic, who excelled last season with 144 points, priced at £6.5 this season, compared to Sadio Mané at £9.5, who finished the season with 147 points. The PPM metric tells a fantasy manager Mané was better based on PP90 and PPM, but Milivojevic was slightly better when breaking down the scoring by match. VAPM is a key metric in this case, showing that both players score nearly identical, when you factor out the points for playing 60 minutes (2-points), using price to yield a per million value.
Using statistical averages from the 2017/18 FPL season, scoring 2400 overall points would have seen your squad finish as a top 50 manager in the overall rankings. To achieve 2400 points, a fantasy manager would need to average 63/PPW. Using data collected on the top 10 captain selections, we average 286 points over the course of the season.
As u/HappyGrinch suggests, work backwards
- Season goal 2400 points (top 50 finish).
- Assume 286 captain points, based on 2017/18 data, a manager needs to score 2114 points.
- Game based on 38 game weeks during the season, this value is adjusted, by +2, considering DGW and additional points from chip activation.
- 2114 divided by 40 equals 52 points per week. Remove 22 points for your starting XI players who play a minimum of 60 minutes. Team needs to score an additional 30 points.
- Figure the average bench price of £18.5 (1 – £5.0 player, 2 – £4.5 players and 1 – £4.5 keeper), subtract that from £100, which equals £81.5.
- Your starting XI need to return 0.36 points per £1 million invested.
While there are no guarantees in fantasy football, using the value added per million (VAPM) metric can help identify players and their potential over the course of the season. If nothing else, it allows you to compare players or varying prices and positions when it comes to your decision-making process.
You can visit the r/FantasyPL Reddit thread on VAPM and use FPLstats for current VAPM values.


